
The Loudon Investment Management investment philosophy focuses on long-term value investing with above average current income and below average volatility. Our portfolios do not look like the overall equity “market” and often not like typical balanced portfolios either. While holdings are spread across a number of market sectors, our portfolios have a point of view which reflects our perception of where value is currently most available in the market place. We are believers in unbalanced diversification.
Value
In both investment portfolios and client relationships
December 2018 Quarterly Update
January 14, 2019
Dear Clients and Friends:
The Market
Wow! Some stock market. We went on a wild ride last year and it may be useful to recount the changes in the Dow Jones Industrials just to put where we are today in perspective.
|
Date |
DJIA Leve |
Period % Change |
Cumulative Change |
|
12/31/2017 |
24,719 |
n.a. |
n.a. |
|
1/26/2018 |
26,616 |
9% |
9% |
|
3/23/2018 |
23,509 |
-12% |
-5% |
|
10/3/2018 |
26,951 |
15% |
9% |
|
12/24/2018 |
21,712 |
-19% |
-12% |
|
12/31/2018 |
23,327 |
7% |
-6% |
|
1/8/2019 |
23,819 |
2% |
-4% |
As you can see, over the full year or full period above, it would appear that not a lot happened with the aggregate returns somewhat negative following eleven years in a row of positive returns. But on an interim basis last year, the volatility is obvious. This provides both risk (of selling at the bottom in anticipation of something worse happening) or buying high with the risk of future market decline ever present. Given all that is happening in today’s world, we can certainly understand why the market would be a little confused as to the future direction of stocks. While volatility is much higher today than in many past periods our approach hasn’t really changed. We just try to buy high quality stocks when they are out of favor in anticipation of them returning to favor at some point in the future.
With respect to buying or selling the stock market in aggregate, we are generally not swayed in one direction or another. Rather when stocks decline, the percentage exposure to equities, relative to bonds or cash equivalents, will also decline. We try to use this as an opportunity to be net buyers of stocks. Conversely, when stocks rise sharply the percentage exposure of stocks to the total portfolio also rises and this is often an opportunity to trim some of the holdings that have become overvalued. This is why many of our portfolios have more cash today than usual. We have simply allowed it to accumulate as the market pushed higher. But with the “correction” we are again net buyers today. As to where we end up, this is tied to the long-term objectives of each portfolio.
But given all that is going on in the world, we don’t think any account today should be 100% invested in stocks.
An Example
We have begun to ease our way into Apple. As many of you know, it peaked at about $230/share in early October along with the market but has since declined about 35% (at the bottom it was down 39%). Over the same time frame the stock market declined about 11%. This is a great example of how even the best of companies can become overpriced and end up with a fairly dramatic correction.
Apple outperformed most stocks over the past several years but the rise was not fully supported by fundamental growth. About two years ago, Apple was selling in the mid 90’s. It then had an almost uninterrupted rise to $230, an increase of 140%. Yet over this same period the company’s earnings and dividends both grew about 40%, very good but considerably less than the price change. Clearly something had to give. Trees don’t grow to the sky and neither do stocks.
Either earnings had to go up faster or the stock price had to come down, and we now know what happened. Most of the high-tech stocks experienced something similar. But today Apple’s relationship between price on the one hand and earnings and dividends on the other has changed. The price decline brought it much closer to its fundamental improvement over that period. Today Apple sells at about 12 times earnings while the stock market in aggregate is 15-16 times earnings, just about in line with its long-term average. At the same time there is now concern that iPhone sales are slowing, particularly in China and other emerging markets. Apple’s response is that the way forward for them is to now sell services and apps through its huge installed base.
And this is where the science of stock picking turns into art. At 12 times earnings, Apple reminds us of past purchases of Microsoft, Cisco and Intel. At time of purchase, these were all selling around 10 times earnings and their performance since then has been outstanding. Do we wait for a lower price or just have faith in the future and go ahead and buy what now looks like a much more reasonably priced security?
Our response to this is somewhere in the middle. We have slowly been buying in some accounts but are adding no more than what we would regard as one half a full-sized position. In the meantime, we wait for either a lower price or increased confidence in the future. The above doesn’t cover all the details of Apple but it is a simplified version of what we look at with every stock. To summarize last year’s and the fourth quarter’s market numbers:
|
Benchmark Index Returns |
12 Months Ending |
3 Months Ending |
|
Lipper Balanced Fund Index |
-4.55% |
-7.60% |
|
S&P 500 Stock Index |
-4.38% |
-13.50% |
|
Russell 1000 Value Index |
-8.26% |
-11.70% |
|
Money Fund Returns |
1.97% |
0.57% |
|
S&P-7-10-Year-US Treas. Bond Index |
0.97% |
3.76% |
|
S&P- Twenty Year+ US Treas. Bond Index |
-1.72% |
4.44% |
This again puts numbers to the volatility that existed last year in the stock market and particularly in the fourth quarter. Also, for the first time in quite a while bonds did better than stocks though their performance was nothing to brag about.
So, what comes next?
To briefly review the economy, from an aggregate point of view we are doing great! Periodically over the past quarter you wouldn’t think so based on news reports, but there are always a few statistical outliers in a generally strong environment. Ultimately it is employment that shows the strength of the economy at the granular level. And employment growth and aggregate employment couldn’t be much better than they are today. This has been particularly true among many who have been left behind in previous periods of strong economic growth – minorities in particular. Just this morning we saw the following in a news summary:
Job openings are outnumbering unemployed workers across increasingly wide swaths of the United States forcing businesses to rethink how they find workers, which could keep pressure on the Federal Reserve to raise interest rates despite a global slowdown.
A slowdown is a very different concept than a recession. Yet not much has been said recently to distinguish between the two. What usually happens in recovery is eventually because of high demand for goods forces the economy to run out of resources forcing prices up in response to scarcity which leads to higher inflation and then the Fed steps in and as former Fed Chair William McChesney Martin once said, “our job is to take away the punch bowl just as the party is getting started.” But this time around, in spite of very strong growth, there is no real sign of an impending inflationary push toward higher wages or prices. We do believe that it will occur eventually, but not yet and probably not this year. There may be a global slowdown but at least so far there are no signs of it in the United States. When statistics are in conflict with what we see all around us, we should question the statistics rather than reality. So, employment is up but economic growth is slowing, at least according to statistical reports and historic precedent. The ongoing sifting between economic statistics, reality and the relationship of both to the financial markets is incredibly complex as, in the short term, sentiment can matter even more than reality. At the moment, sentiment is focusing more on modestly rising interest rates rather than the underlying strength in the economy.
For our part, this is why we don’t make economic or market projections but instead concentrate on stock quality, income yield, growth and valuation. To paraphrase Ben Graham, Warren Buffet’s primary mentor when he was at Columbia: “In the short run the stock market is a voting machine but in the longrun it is a weighing machine.” In other words, short term, the market votes for its favorite companies or concepts. If the voting continues enthusiastically in one direction for too long with the stock market outpacing fundamental progress, stocks eventually become overvalued. And that is what happened last year, as pointed out in our Apple example. To a greater or lesser degree, it also occurred pretty much across the board with tech stocks but others were dragged down with them with the shifting of consensus on what the future might hold.
So, in many ways, what happened starting last October was a “technical” correction. The underlying economy and corporate earnings were very strong but the voting machine’s enthusiasm went too far and stocks eventually became priced for perfection – and the world is never perfect. Eventually when buying exhausts itself and some imperfections show up (we certainly have a number to choose from today) the market falls of its own weight and what went up the fastest often comes down the same way. This is not unusual and has happened more often than not in the past.
Eventually the weighing machine gets back to real corporate worth and growth. This is the process we are in now. While fundamentals remain strong, it is still difficult to make a case that stocks are really undervalued. Rather they have moved much closer to “fair value” from which it is easier to vote for real value rather what is most popular.
Largest Holdings
Despite the volatility in the market the list our top twenty holdings has not changed much since the end of September. Smaller holdings Kraft Heinz and Tapestry (formerly Coach) dropped out of our top holdings due to poor performance and tax loss selling over the last quarter, replaced by PepsiCo and Illinois Tool Works.
Perhaps the most interesting name on this list is Illinois Tool Works (ITW), a company we purchased throughout the quarter, and it is a company we are very excited to add to portfolios at current prices. ITW manufactures a broad range of industrial products and equipment, including automotive equipment for manufacturers, food equipment, welding, polymers and fluids, and construction products to name just a small sample. It is a name we have owned a few times over the long term, and in our experience it is truly best in class. A dividend aristocrat, Illinois Tool Works has raised its dividend each year for over fifty years which puts it near the top of the pack of all U.S. companies. Due to its financial stability the stock rarely comes down enough in price to be eligible for purchase under our measures of value.
In 2018 ITW stock showed a slow and steady decline kicked off by the brief market correction near the end of January. The price slide continued based largely on concerns regarding its Automotive OEM division which makes up nearly a quarter of revenues as well as the possible impact of tariffs and other cost increases. The other thing that was happening is that increasing amounts of stock market money were being allocated to technology stocks, further depressing any company with short term issues. The stock made it on our radar after it had declined about 25% from its peak, which was around the same time the company issued a greater than 25% increase in its dividend, hardly a sign of financial stress. We began purchasing small positions during the third quarter and have bought more as the stock declined in December with the rest of the market. We still have room to add more ITW in most accounts, and it is likely that we may continue to add shares as, by our measures, the stock remains a bargain today.
Looking ahead, Illinois Tool Works is a company that has the potential to grow earnings and the dividend at 8-10% or more over the next few years, which could be helped by the continuing tailwinds of growing GDP. While tariffs are a factor, ITW largely produces where it sells, so the impact is not as great as with other companies, and only about 2% of its cost of materials comes from China. Another possible advantage is the company’s decentralized structure that places responsibility on managers at the lowest level possible. This entrepreneurial spirit also makes it easier for the company to adjust quickly to the needs of particular customers, as it has operations in over 55 countries – bureaucratic paralysis is kept to a minimum. Taken as a whole, with reasonable growth prospects and a stock price that is “grossly undervalued” by all of our measures, Illinois Tool Works is a company we are thrilled to buy at current levels and one we expect to hold for a very long time.
The other name making it onto our top twenty list is not a new one. PepsiCo is a long term holding that we have trimmed back over time. While other stocks were moving lower, Pepsi stock held its ground and finished the quarter flat, which was enough to jump it up a few spots on our list.
Looking at the names that dropped out, we suspect Kraft will make it back into our top twenty holdings at some point because the stock remains very attractive and we will be unwinding some from December tax swaps through the early part of this year buying more Kraft. The same may be true of Tapestry as the news has generally been positive – both earnings and revenues came in ahead of expectations for the most recent quarter ended October 30, though you wouldn’t know it from the stock price. Looking ahead, recent acquisitions of Stuart Weitzman and Kate Spade brands should help to bolster the Tapestry brand and help to lower volatility as trends go in and out of favor.
As we begin 2019, we are able to find many more stocks we are truly enthusiastic to buy than we have seen in several years. We are particularly enthusiastic about the “dividend aristocrats” which generally include very high-quality companies that have raised their dividends each year for a minimum of 25 years. The current environment provides a great opportunity to swap out some of our relative “winners” that now look overvalued, as well as to upgrade the relative quality of our holdings with each trade.
So what happens next?
Since the December 24 low, the market has rebounded about 10%. As shown below, this sort of rebound is not unusual in the context of an economy that is still growing at a healthy pace.
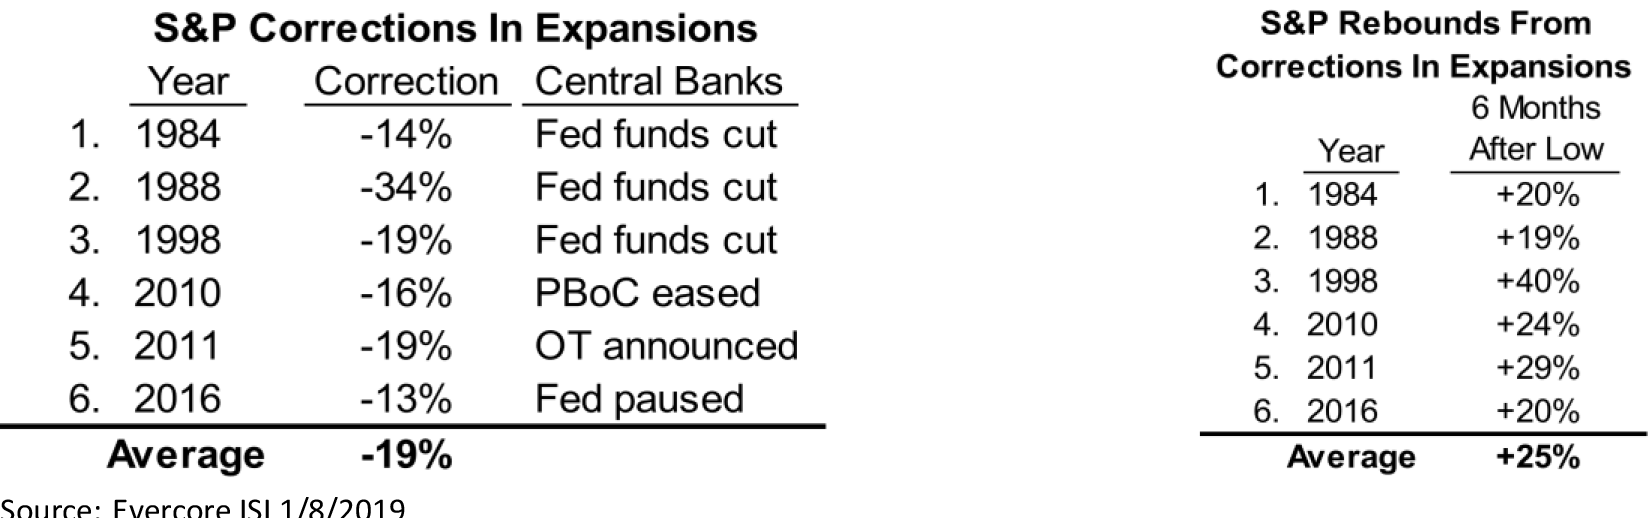
Source: Evercore ISI 1/8/2019
In fact, if history holds true (not a sure thing in today’s markets) the rebound could have a ways to go. This also gives no indication of where we will end the year. Common sense suggests to us that given expected 2019 earnings growth (quite good but not as good as last year when a onetime benefit was received from corporate tax cuts) that the case for a moderate upside is quite well supported. It also seems that the Fed has not had a particular impact but with interest rates rising this could change. So the ebullient unrestrained market may be behind us but the evidence does not suggest that we should expect that we will continue to go down.
As we go forward and puzzle this out, it is not unusual to see a shift in market leadership though we don’t suggest we know where this may appear. What we do know is that our value type of value stocks have been under pretty severe pressure since the previous market peak way back in 2007-2008.
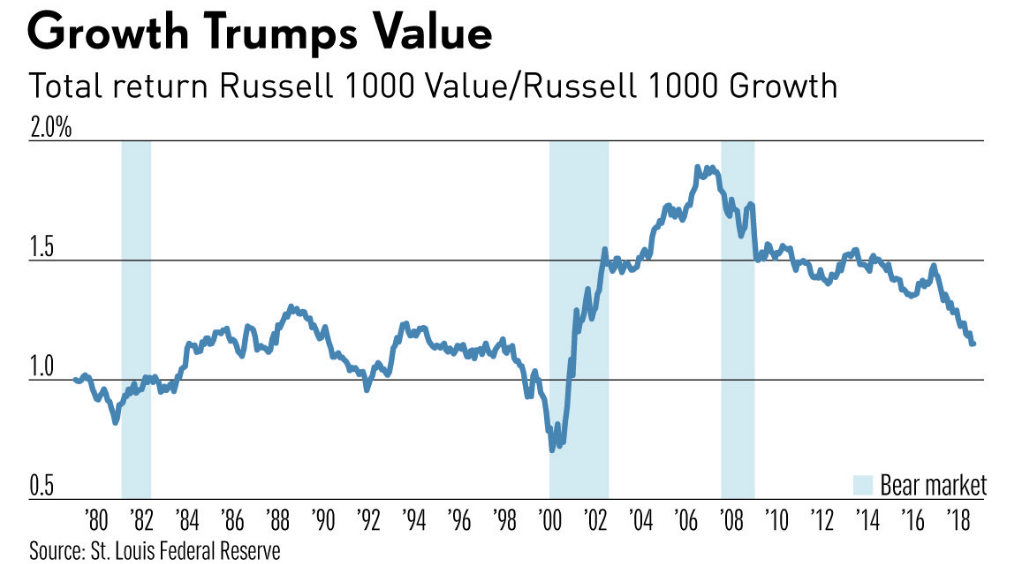
The correction could very well suggest that this is about to change. It won’t happen because growth stocks stop growing their earnings but more because future unrestrained optimism is likely to be more modest. Under these conditions, a realistic appraisal of earnings could likely result in our high quality out of favor approach leading the way.
Of particular interest from the above is the fact that the movement into value following the tech bust in 2000 and out of value into growth equites following the peak in the finance markets in 2007 has been a lot more extreme than in the twenty years leading up to 2000 – another example of more volatility over the more recent past. Whenever it does happen, it is entirely possible the move back into value could also be quicker and more extreme than was the case historically. We welcome any questions or insights all of you may have.
Very truly yours,
Loudon Investment Management LLC
DML/ELS/JJS/LO